The AI Tooling Map: What 361 AI Companies Reveal
Published . Updated .
AI means artificial intelligence. The supplied Chiri Atlas dataset contains 361 unique company profiles. HR means human resources. Its largest category is HR & Recruiting, with 49 companies. Sales & Marketing follows with 41. These counts describe this dataset, not the entire AI market.
The dataset combines records with different version dates. Most carry 2025 dates, but 20 carry 2026 dates. It is not a single late-2025 snapshot.
Which categories contain the most companies?
The dataset assigns one category to each company. Four categories contain 134 companies, or 37.1% of the sample:
| Recorded category | Companies | Share of 361 |
|---|---|---|
| HR & Recruiting | 49 | 13.6% |
| Sales & Marketing | 41 | 11.4% |
| Customer Support | 25 | 6.9% |
| Content & Design | 19 | 5.3% |
The Operations category contains 10 companies. Knowledge Management contains 8. Together, those two categories account for 18 companies, or 5.0% of the sample.
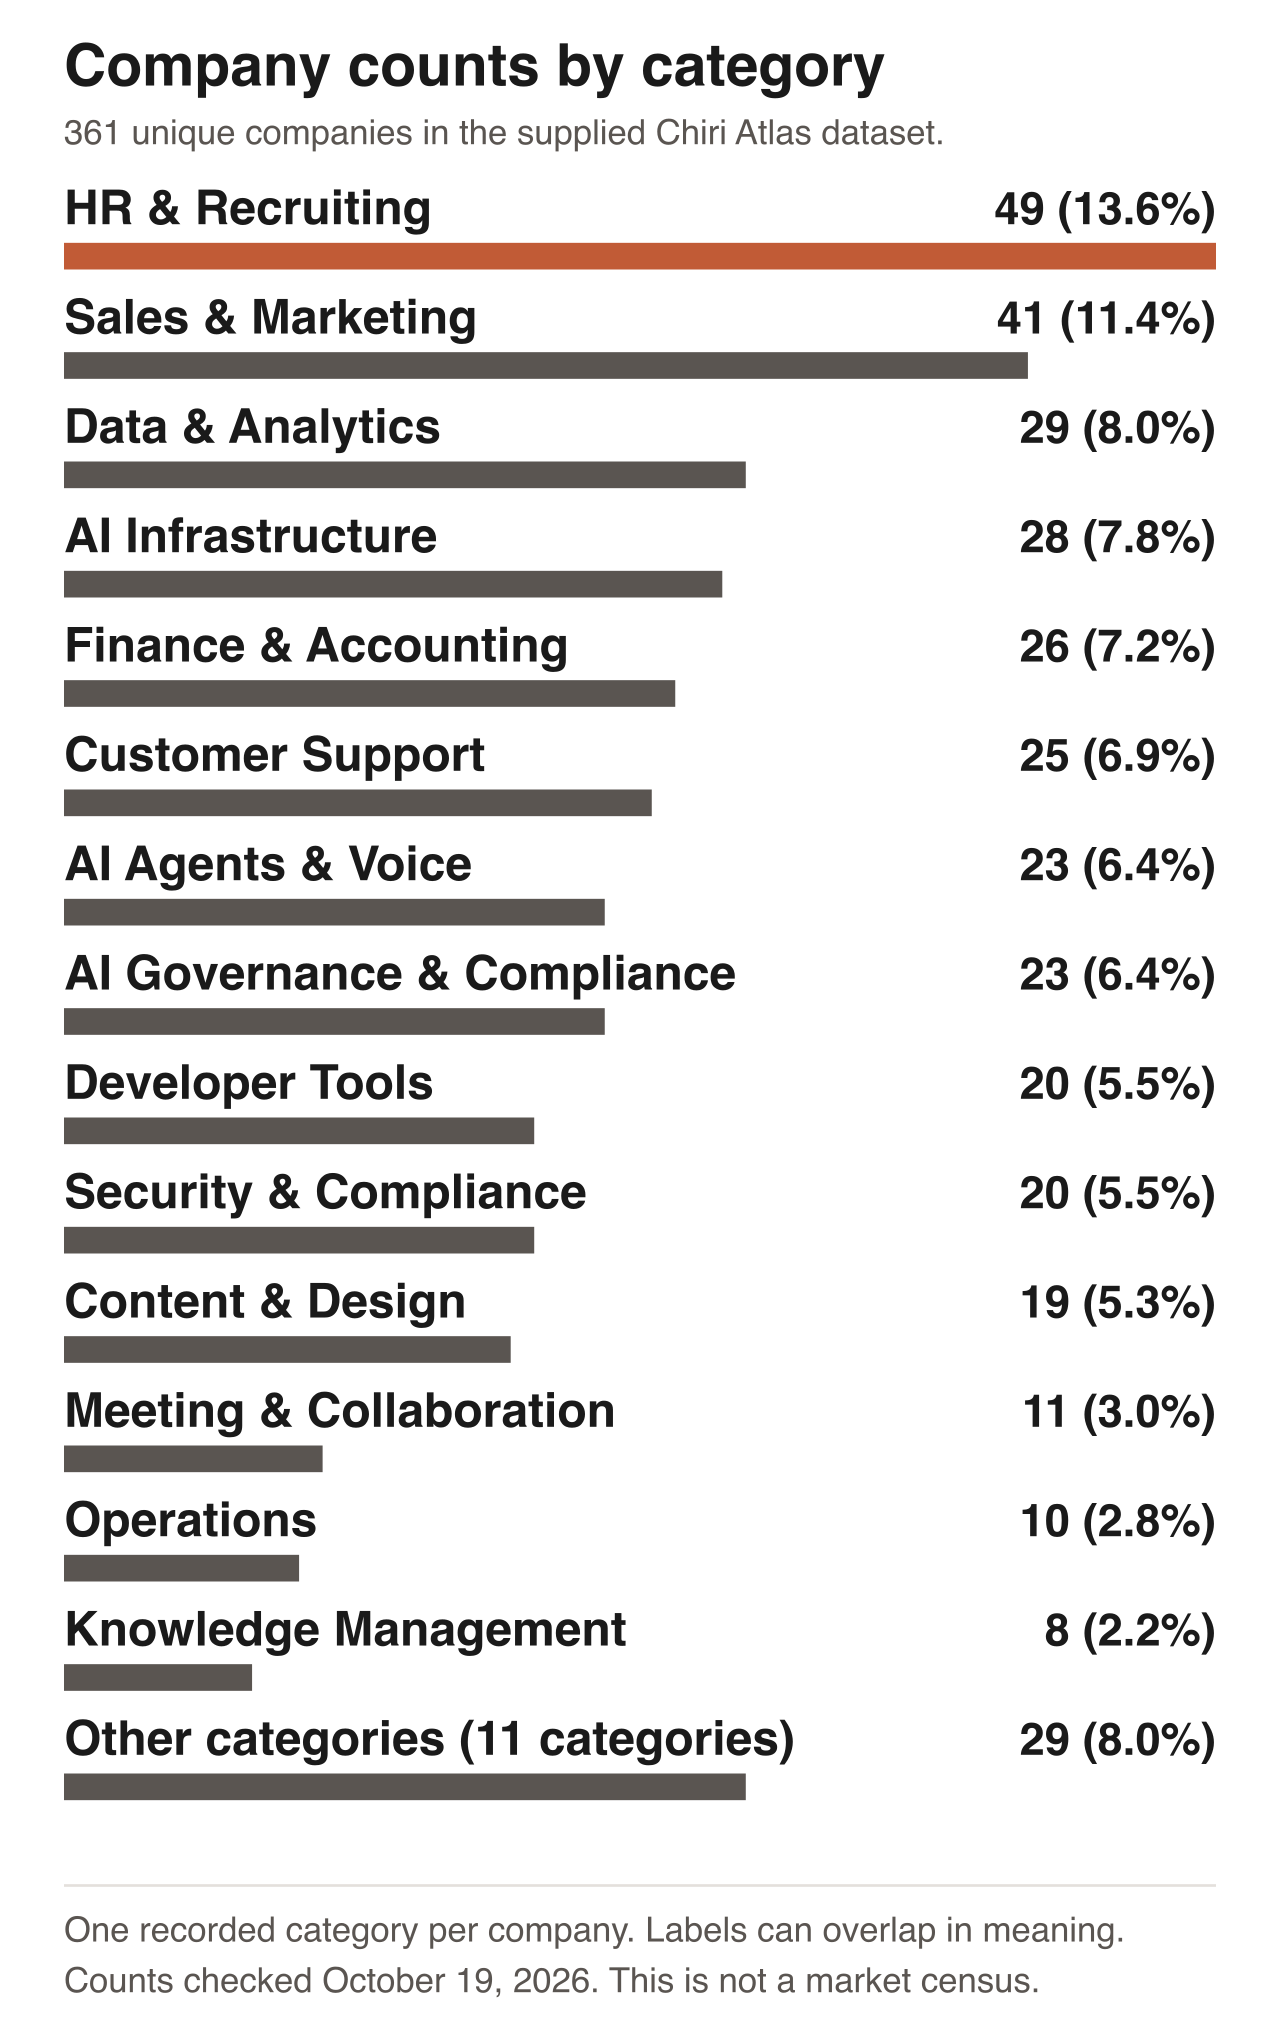
Source: the supplied 361-company Chiri Atlas dataset. Category labels come directly from its category column.
These labels do not completely separate customer-facing work from internal operations. Human resources, for example, serves internal operations. Some other categories also overlap in meaning. A company can support several tasks even though this dataset assigns one category.
Category counts do not measure customer demand, spending, product quality, or return on investment. They cannot show why suppliers chose a category. Choose a tool against your task and requirements, not its category's popularity.
What do founding years show?
The dataset states a founding year for 355 companies and leaves 6 blank. The median founding year is 2019. Of those 355 companies, 155, or 43.7%, state 2020 or later.
Company age alone does not establish financial strength or service quality. Check support arrangements, data export, ownership, and exit terms for each supplier.
Employee entries mix exact counts, overlapping ranges, estimates, and conflicting figures. We do not publish employee-band percentages without a documented rule for resolving those differences.
What do the compliance flags show?
The extraction records Boolean flags: each flag is either true or false. The following table counts true values across all 361 rows.
| Recorded flag | Companies | Share of 361 |
|---|---|---|
| SOC 2 | 281 | 77.8% |
| GDPR | 267 | 74.0% |
| ISO 27001 | 232 | 64.3% |
| HIPAA | 58 | 16.1% |
| Any compliance flag | 319 | 88.4% |
| No true compliance flag | 42 | 11.6% |
SOC 2 refers to a controls examination and report. GDPR refers to the General Data Protection Regulation. ISO 27001 refers to an information security management standard. HIPAA refers to the Health Insurance Portability and Accountability Act.
These labels describe different requirements and evidence. They are not interchangeable certifications. The counts describe flags in this extraction, not independently verified company compliance.
For definitions, see AICPA's SOC resources, ISO's standard overview, and HHS guidance on HIPAA certification.
A true flag does not prove a current audit, certification, legal compliance, or suitability for your data. A false flag can reflect missing research rather than an absent control. Ask the supplier for current evidence and check its scope against your requirements.
What should a buyer do with this map?
- Define the task and its acceptance criteria before comparing suppliers.
- Check which data and systems the product can access.
- Test representative cases, including errors and unusual inputs.
- Confirm who owns the code, configurations, and operating knowledge.
- Check support, data export, and exit terms.
- Verify relevant controls directly with each supplier.
Talk to the Chiri team about a supplier assessment or to request the research dataset. You can also review Chiri's services.
Method and limits
We counted the supplied file, assets/chiri-atlas-361-dataset.csv, on October 19, 2026. It contains 361 rows and 361 unique slugs. We used the category column, not the separate function column. The function column contains 34 blank entries.
Each category percentage uses all 361 rows as its denominator. Founding-year calculations use the 355 rows with a numeric year. Compliance percentages use all 361 rows and count each named flag separately. The same company can have several compliance flags.
The latest_version column ranges from 20250915 to 20261003. Of its records, 341 carry 2025 dates and 20 carry 2026 dates. These values identify recorded versions; they do not prove current company facts.
This is a selected research sample, not a census of every enterprise AI company. We did not independently reverify every underlying company claim. The dataset does not measure supplier reliability, market share, or investment returns.
Questions and answers
Does this cover the entire AI market?
No. It covers 361 unique company profiles in the supplied Chiri Atlas dataset. Category counts describe that sample only.
Does a crowded category prove greater value?
No. Category counts do not measure customer outcomes, spending, or product quality. Evaluate a supplier against your own task.
Are the compliance claims verified?
No. We counted extraction flags. Ask each supplier for current evidence and check its scope.
How current is the data?
Recorded versions range from September 15, 2025, to October 3, 2026. The extraction is not a live market feed.
How can I request the dataset?
Contact Chiri and ask for the research dataset. This page does not provide automatic email delivery.